Bucktown's Median Price Dropped 3 Percent. Price Per Square Foot Rose 23. Both Are True.
Anyone comparing Bucktown against a handful of other North Side neighborhoods this year has probably run into the same confusing pair of numbers. As of March 2026, the median sale price for a home in Bucktown was $698,000, down 3.0 percent from a year earlier. In the same report, the median price per square foot was $466, up 23.1 percent over that same twelve months. Homes were also selling faster, in about 34 days on average instead of 50.
A falling median and a fast-rising per-square-foot price shouldn't sit next to each other in the same market snapshot. One says values softened. The other says buyers are paying sharply more for the same amount of space. If you're weighing Bucktown against Logan Square or Wicker Park based on the headline median alone, you're reading the wrong number, and it matters for both what you offer and what you list at.
A median sale price is not a measure of appreciation. It's the middle value of whatever happened to close that month, ranked from lowest to highest. It says nothing about whether any individual property gained or lost value. It only reflects which properties, out of all the ones on the market, actually sold.
That distinction barely matters in a high-volume market like citywide Chicago sales, where thousands of transactions smooth out the noise. Over the three months ending July 2026, the citywide median sale price was $430,000, up 8.8 percent year over year, and the citywide median price per square foot moved in the same direction at $308, up 10.0 percent. Two measures, same story, because the sample size is large enough that the mix of what sold each month barely shifts.
Bucktown doesn't have that luxury. Only 64 homes sold there in March 2026, down from 93 the year before, a volume drop of roughly 31 percent. When a neighborhood's monthly closings are counted in dozens instead of thousands, the median becomes a story about which specific properties happened to change hands, not a story about value. A month with a few more modest vintage condos in the mix pulls the median down. A month with a few more full-gut single-family rehabs pulls it up. Neither shift means the underlying market moved.
Price per square foot is the more stable measure precisely because it adjusts for size. A 900-square-foot condo and a 3,200-square-foot single-family home selling in the same month will drag a raw median in opposite directions depending on which one happens to close, but they'll both register their true per-foot value regardless of size. That's why Bucktown's 23.1 percent per-square-foot gain is the number worth trusting, and it's not a small gain. It outpaces the citywide per-square-foot growth rate of 10.0 percent by more than double, even accounting for the fact that the two figures come from slightly different reporting windows, March 2026 for Bucktown and the three months ending July 2026 for the city overall.
Put plainly: buyers in Bucktown are paying about $466 for every square foot of housing, a premium of roughly 50 percent over the $308 citywide median, and that premium grew faster in the past year than the city's premium did. That is not the profile of a cooling neighborhood. It's the profile of a neighborhood where demand for the actual square footage on offer kept climbing while the specific batch of homes that sold happened to skew smaller or less expensive per unit.
A falling median in a thin market usually means the sample changed. It rarely means the neighborhood did.
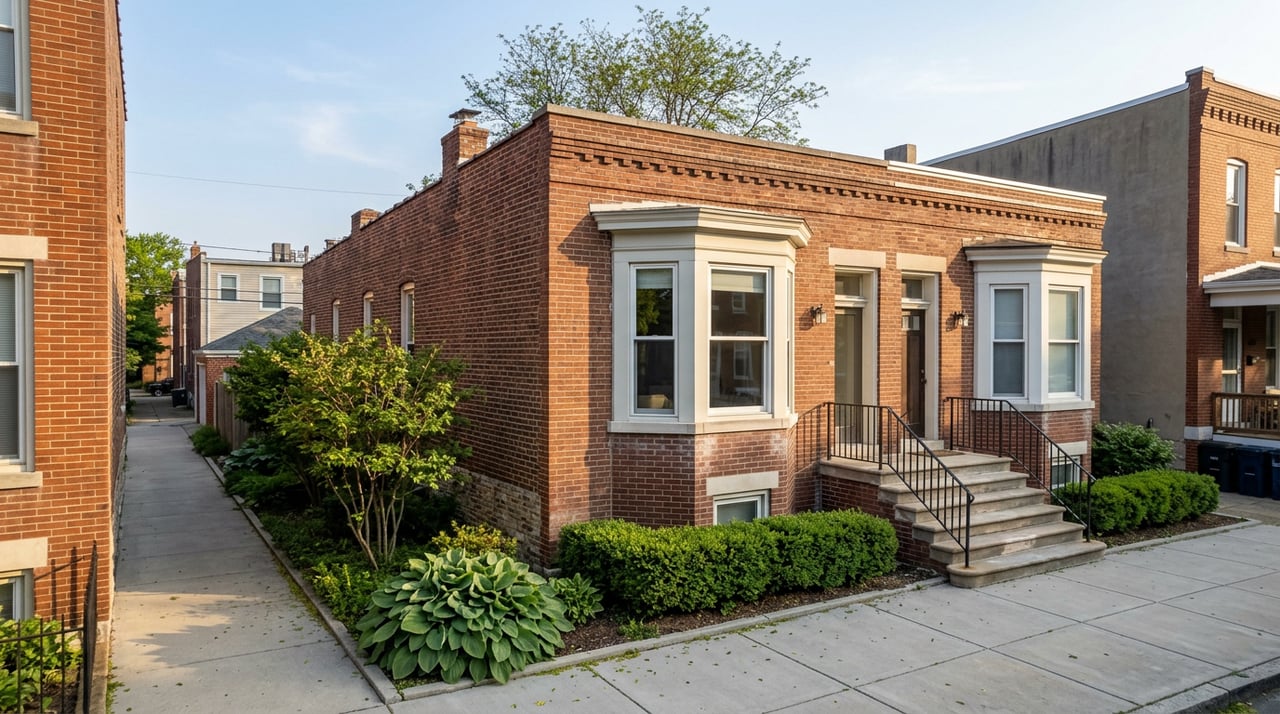
Some neighborhoods are built out of one dominant product type, which makes their medians more reliable even at low volume. Bucktown isn't one of them. Its housing stock runs from Victorian-era workers' cottages and greystones to converted industrial lofts, duplex-down condos, and new single-family construction on 25-by-125-foot lots, often within a few blocks of each other. That variety is part of what makes the neighborhood appealing to buyers who want character options rather than a single condo tower's worth of nearly identical units. It's also exactly the condition that makes a blended median unstable when only a few dozen sales close in a given month.
A neighborhood where every closing is a similar 2-bedroom condo will have a median that tracks real appreciation fairly closely, because there's little variation left for the sample to shuffle. A neighborhood where the same month can include a $2 million single-family rehab, a $500,000 vintage condo, and a duplex-down townhome has a median that's sensitive to which of those three showed up, and in what proportion, this particular month versus last.
This is worth sitting with if you're cross-shopping Bucktown against a neighborhood with more uniform inventory. The two headline medians are not measuring comparable things. One is a fairly stable read on a homogenous product. The other is a number that can swing on the composition of a single month's closings.
If you're using median price as your primary tool to rank neighborhoods against each other, a market like Bucktown will systematically mislead you in months when the transaction mix skews unusually toward one property type or another. A few adjustments make the comparison more honest:
None of this means the headline median is wrong. It's an accurate description of what actually sold. It's just not the same thing as a description of whether Bucktown got more or less expensive to own.
Does a falling median mean Bucktown values are falling? Not on its own. The March 2026 dip coincided with a 23.1 percent jump in price per square foot and faster sales, both signals that run counter to a genuine slowdown. The most likely explanation is that the specific batch of homes that closed that month skewed toward smaller or lower-priced units relative to the prior year, not that comparable properties lost value.
How should I actually compare Bucktown's prices to another neighborhood's? Start with price per square foot within the same property type, condo to condo, single-family to single-family, rather than the blended neighborhood-wide median. In a lower-volume market, that adjustment removes most of the noise a monthly median introduces.
Is this currently a buyer's market or a seller's market in Bucktown? The days-on-market compression from 50 to 34, combined with the per-square-foot growth outpacing the city as a whole, points toward continued seller leverage even in the same reporting period where the topline median looked soft. A seller who anchors a listing price to the falling median alone risks underpricing a property that the per-square-foot data says is still in demand.
If you're weighing Bucktown against another Chicago neighborhood and want the property-type-specific comparison rather than the blended headline number, that's the kind of pricing conversation Dwell Wisely Group has with buyers and sellers every week. Reach out and we'll walk through what the current data actually says about your specific property type and price point before you make an offer or set a list price.
Whether working with buyers or sellers, Dwell Wisely Group provides outstanding professionalism into making their client’s real estate dreams a reality. Contact the Dwell Wisely Group today for a free consultation for buying, selling, renting, or investing in Chicago.
Get in touch with our team to learn more.

1875 N DAMEN AVE CHICAGO IL 60647